Economics – 3/29/17
I. Bellwork : Q&A
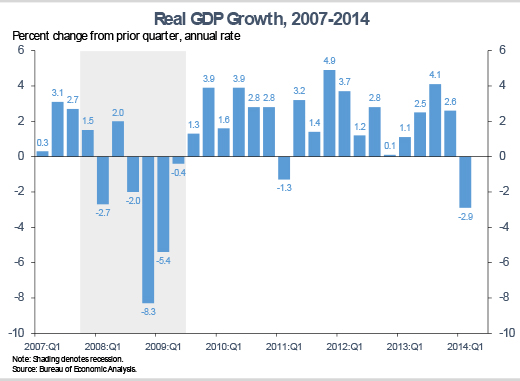
- What is the topic of the graph?
- What does the x-axis represent?
- What does the y-axis represent?
- Explain an observation you can make based on the graph
- What do you foresee happening about 5 years from now?
II. Objective
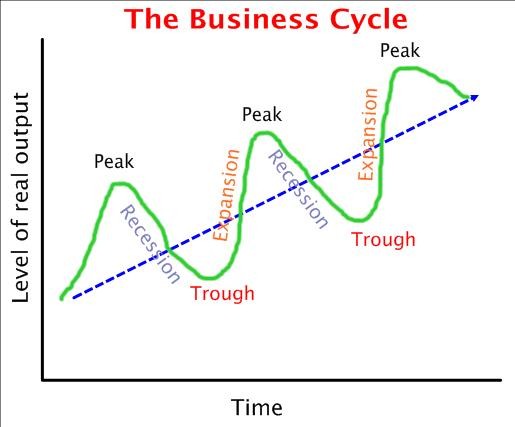
- Analyze the stages in the business cycle, their impact on the economy, and fiscal and monetary policies used by government to smooth periods of rapid growth and decline to achieve economic objectives.
- Explain and identify the stages of the business cycle and events leading up to and following the Great Depression.
- Evaluate an author’s premises, claims, and evidence by corroborating or challenging them with other information.
III. Videos
IV. Notebook –
A. Copy and label Diagram Below
B. Pages 356-357 – Create a Cause and Effect Map of the Great Depression & put it in your notebook
V. Classwork
- Page 353 Vocabulary (12)
- Page 359 – Q&A 2, 3 &5
Leave a Reply