Economics – 12/13/13

1. Based upon the graph, explain in detail what happened between 2007-2011.
2. How would you categorize as happening during the time that is shaded. Explain why.
II. Objective:
- Identify how inflation is measured, the causes of inflation, and its impact on the economy.
III. Discuss 13-2 Inflation pages 361-367
- Inflation Video
- Inflation – Winners and Losers
- Demand Pull and Cost Push Inflation
- Demand-Pull and Cost-Push Inflation Interactive
IV. Notebook Work
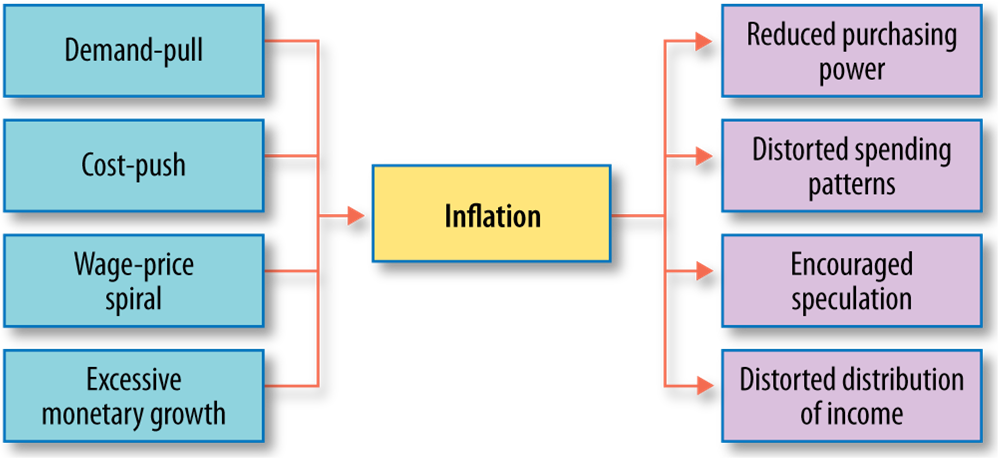
- Page 377 – Copy Inflation Diagram
V. Classwork
- 13-2 Guided Reading Activities
- Page 361 Content Vocabulary (15)
Leave a Reply