Economics – 12/20/18
I. Bellwork : Q&A
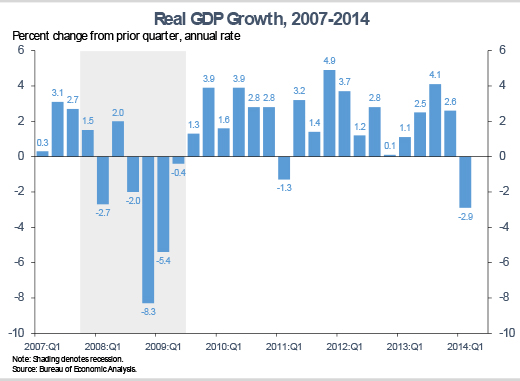
- What is the topic of the graph?
- What do the x-axis and y-axis represent?
- What are some observations you can make based on the graph?
II. Objective:
- Explore the benefits and disadvantages associated with production (GDP) and consumption in a a market/capitalistic economy.
- Evaluate differing points of view on an issue by assessing the authors’ claims, reasoning, and evidence.
III.Notebook
- Pages 356-357 – Cause and Effect Map of the Great Depression
- GDP and Fiscal Policy (Cause & Effect)
IV. Classwork
A. Power of the Market – The Pencil
- 3-5 Sentence Summary
- Explain the example used and what the main points Milton Friedman was attempting to make.
- 6-8 Sentence Summary
- Explain the examples used in the video and the points made about each step in the materials economy. Relate this to GDP (production of goods and services).
Leave a Reply