Economics SS – 7/03/14
I. Objective:
- Determine what creates demand and what factors cause demand to change
- Plot a demand curve and apply the law of demand
II. Demand Pages 91-95
III. Classwork
A. Section 4-1
- Page 91 Vocabulary 11
- Page 95 2-6 Questions & Answers
B. Plotting Demand Curves
- Review Demand Schedule & Demand Curve – Figure 4.1
- Complete the demand curve worksheets attached
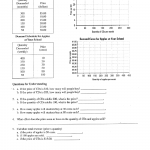

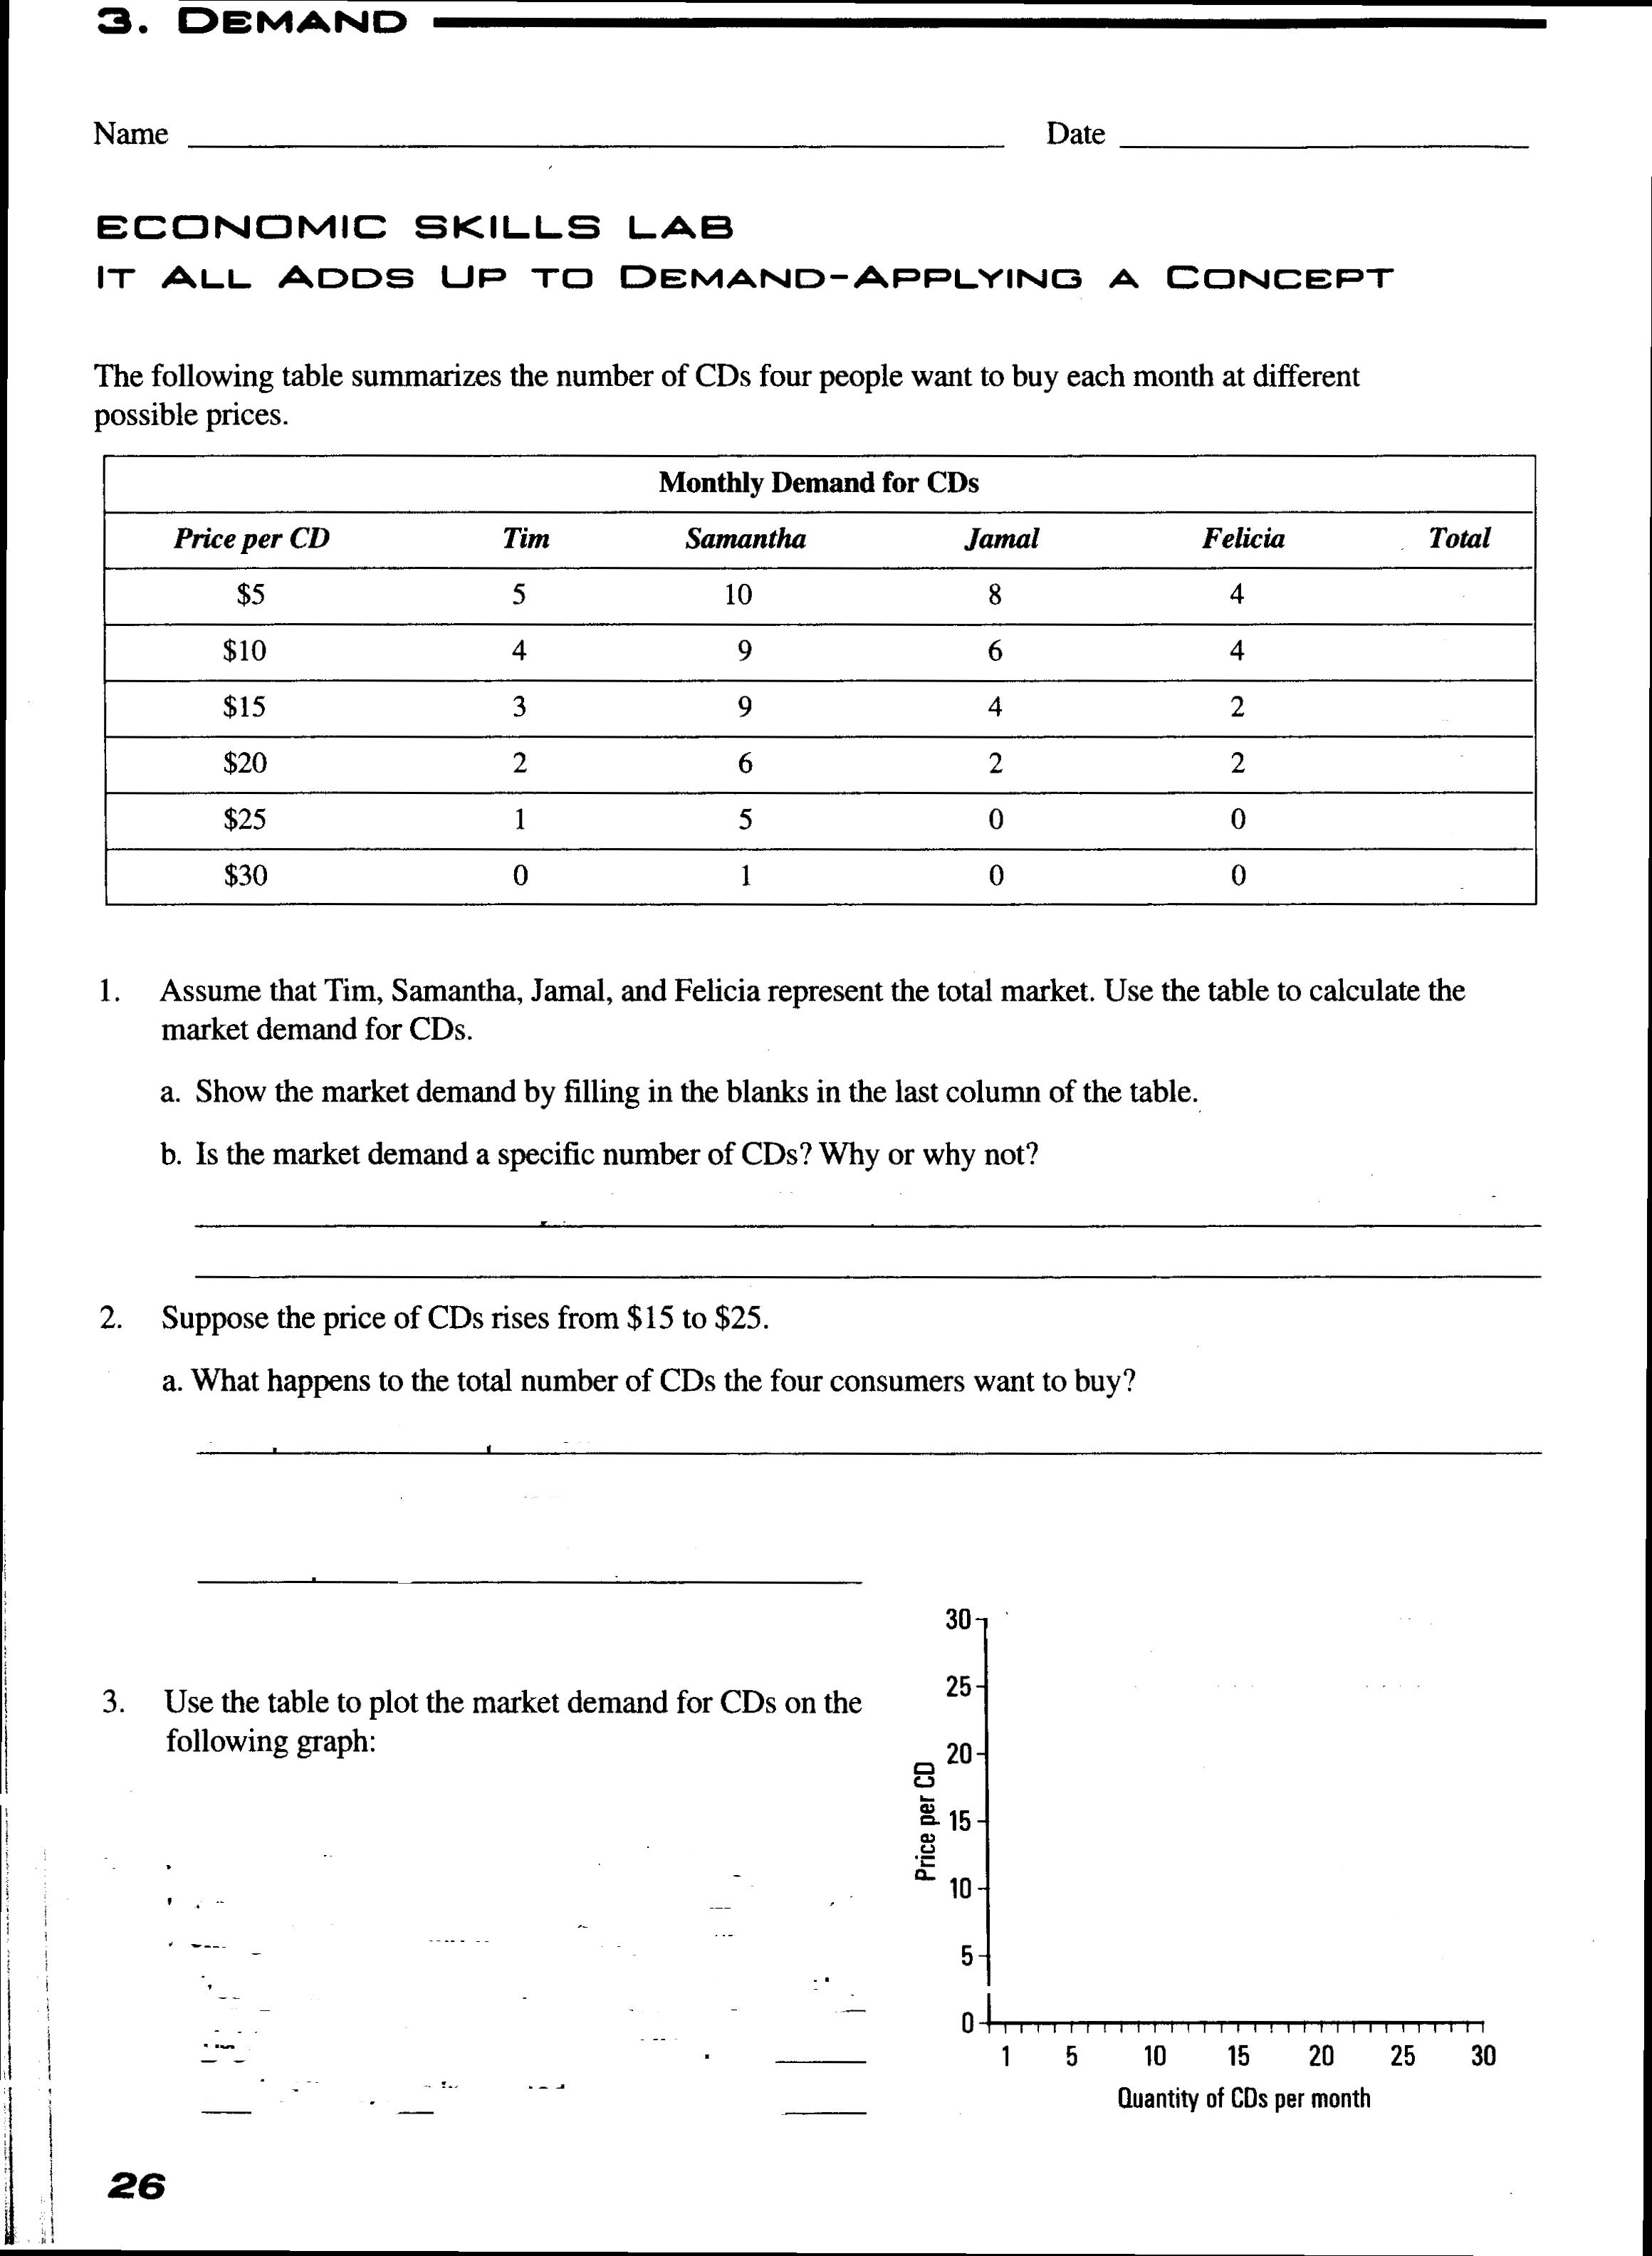
- 2. Review Market Demand Curve – Figure 4.2
- A. Complete Market Demand Worksheets Below:
- Demand curve & Market demand Worksheet 1

IV. Discussion & Notes – Demand Pages 91-95
- Identify the Conditions necessary for Demand (3)
- Define Microeconomics
- Demand Schedule & Demand Curve – Figure 4.1
- Law of Demand –

- Video to watch: Diminishing Marginal Utility

IV. Economics USA Video–
Supply and Demand Watch 0:00 -11:00 Copy Questions & Answer questions below:
- What happened to California in 1975?
- What were the residents of Marin County forced to do?
- Why did Marin County have this problem?
- List some sacrifices the residents made.
- What did some farmers and landowners do?
- How did the lack of water affect the marginal utility of water?
- How did more water affect the marginal utility of water?
Leave a Reply