
The download attachments are for your reference purposes. They make useful study materials.
Unit 8.6 : Unit Challenge Bubble Map
Students, look over your current bubble map of our Unit 8.6, and determine what questions we can answer now, and what other questions we can add to our map. This will be our focus on Monday. First, it will be individually done, then with your table group, and then followed by the whole class.
For genuine questions that are shared with the class, formative extra credit points may be earned. Many of you can use these points, since many of you have performed below average on our daily bellwork!
Posted in Class News
Leave a comment
Attention 3rd Hour Only!
Bellwork scores have been added to your running totals. Thus far, we have had 10 points for bellwork. We are slowly getting to be on-task. Keep it up!
Posted in Class News
Leave a comment
Attention Hours 1 & 3: Your Bellwork Scores Have Been Posted!
If you did poorly on your first bellwork, I suggest that you no longer dilly-dally when you walk into class, as the points for bellwork will accumulate over marking Period 3, since each bellwork will count for 5 points whenever it is picked up and graded. Also remember that it will be a running total through March 25, 2020.
Posted in Class News
Leave a comment
Reminder: Starting Tuesday, January 21, 2020: Daily Bellwork Requires Straight-edge Lined Paper.
One packet of 100 papers will be enough for the rest of the school year.
Following directions gets you half-way there.
Having the correct answer gets you the other half!
Posted in Class News
Leave a comment
Uncover Your Ideas
Steps:
- Each group is assigned one of five types of natural hazards (tornado, flood, hurricane, earthquake, and volcanic eruption).
- BEFORE analyzing your hazard data, make a prediction about where the natural hazard is likely to occur based on the following guiding questions:
| Guiding Questions to Be Answered: 1. Which states or regions (midwest, southeast, west, etc.) do you predict are likely to experience this hazard in the future? 2. What is your initial reasoning for this prediction? 3. What evidence do you need to support this claim? |
3. Each group is given a map that corresponds to its assigned hazard from the resource
8.6L3Uncover_Student_HazardDistributionMaps. (Given)
Note: The maps provide frequency data by state for each natural hazard.
4. Analyze and interpret the data by looking for patterns in the numbers for each state by answering the following guiding questions:
| Guiding Questions to Be Answered: 1. Does the hazard occur in every state? How much variation do you see in the number of events? 2. Which states have similar numbers? Are they neighboring states? 3. Where are the most events? Where are the least events? |
5. Decide on a ranking system for your data. Now do this by grouping the range of values for the natural hazard into three categories (You decide the numbers that define the ranges).
- highly likely (red) : For example 7-10
- somewhat likely (orange) : For example 4-6
- less likely (yellow) : For example 1-3
6. Color in the states on your map to match your ranking system. (You may leave states uncolored -white- if there are few or no events. For most natural hazards, some areas of the map will be left white.)
Posted in Class News
Leave a comment
REMINDER: WEDNESDAY, JANUARY 15, 2020: SHORT TEST ON LESSONS 1 & 2 IN UNIT 8.6
What to Study:
It’s simple: If you study your ISN notes and any handouts given for Lessons 1 & 2 in Unit 8.6, then you will excel on tomorrow’s test. There will be a few multiple choice questions with a couple of short-answer questions!
Posted in Class News
Leave a comment
Compliments of 6th Hour Who Prepared your lab for This Week
*Unit 8.6, Lesson 2:
Forecasting the Likelihood of Natural Hazards
Lesson Question:
- How can we predict where a natural hazard like a flood will occur?
Learning Performance:
- Make a claim that forecasts a natural hazard (flooding), based on patterns in the location and frequency of past events, as well as the assumption that the conditions that created those hazards in the past will remain the same in the future.
Concepts & Practices:
| Lesson Key Concepts | Patterns in the location and frequency of past natural hazard events can be used to predict future events.Predictions based on the frequency of past events can only be made in terms of likelihood (probability); these are called forecasts.In order to make forecasts based only on records of past events, scientists must assume that the conditions that created those hazards in the past will remain the same in the future. |
| Lesson Key Practices | Organize and describe data.Analyze data to identify patterns and determine relationships.Use analyzed data to provide evidence and make predictions. |
Lesson Takeaways:
- A natural hazard forecast is a scientific claim about the likelihood of a natural hazard event occurring in a particular place.
- Historical data about where and how often natural hazard events have occurred is one form of evidence that scientists can use to support a hazard forecast.
- A forecast is a claim about the probability (likelihood) of an event occurring, based on understanding and evidence produced through scientific observation and reasoning.
- Scientists are able to identify patterns in data and make a claim about how likely it is that natural hazards will occur in a particular place.
- A claim depends on the assumption that the conditions that created those hazards in the past will remain the same in the future.
- It is possible to forecast the location of flooding and how often flooding will occur based on the area and frequency of past flooding events.
- We can also reason that they must assume that the conditions that created the flood, such as the shape of the valley, and the overall amount of precipitation over the year, will remain the same in the future.
- Source: https://mi-star.mtu.edu/
Posted in Class News
Leave a comment
Unit 8.6 Bubble Map: Compliments of our First Hour
- If the picture below is difficult for you to see, copy and paste it on a word document and resizes it to your liking.
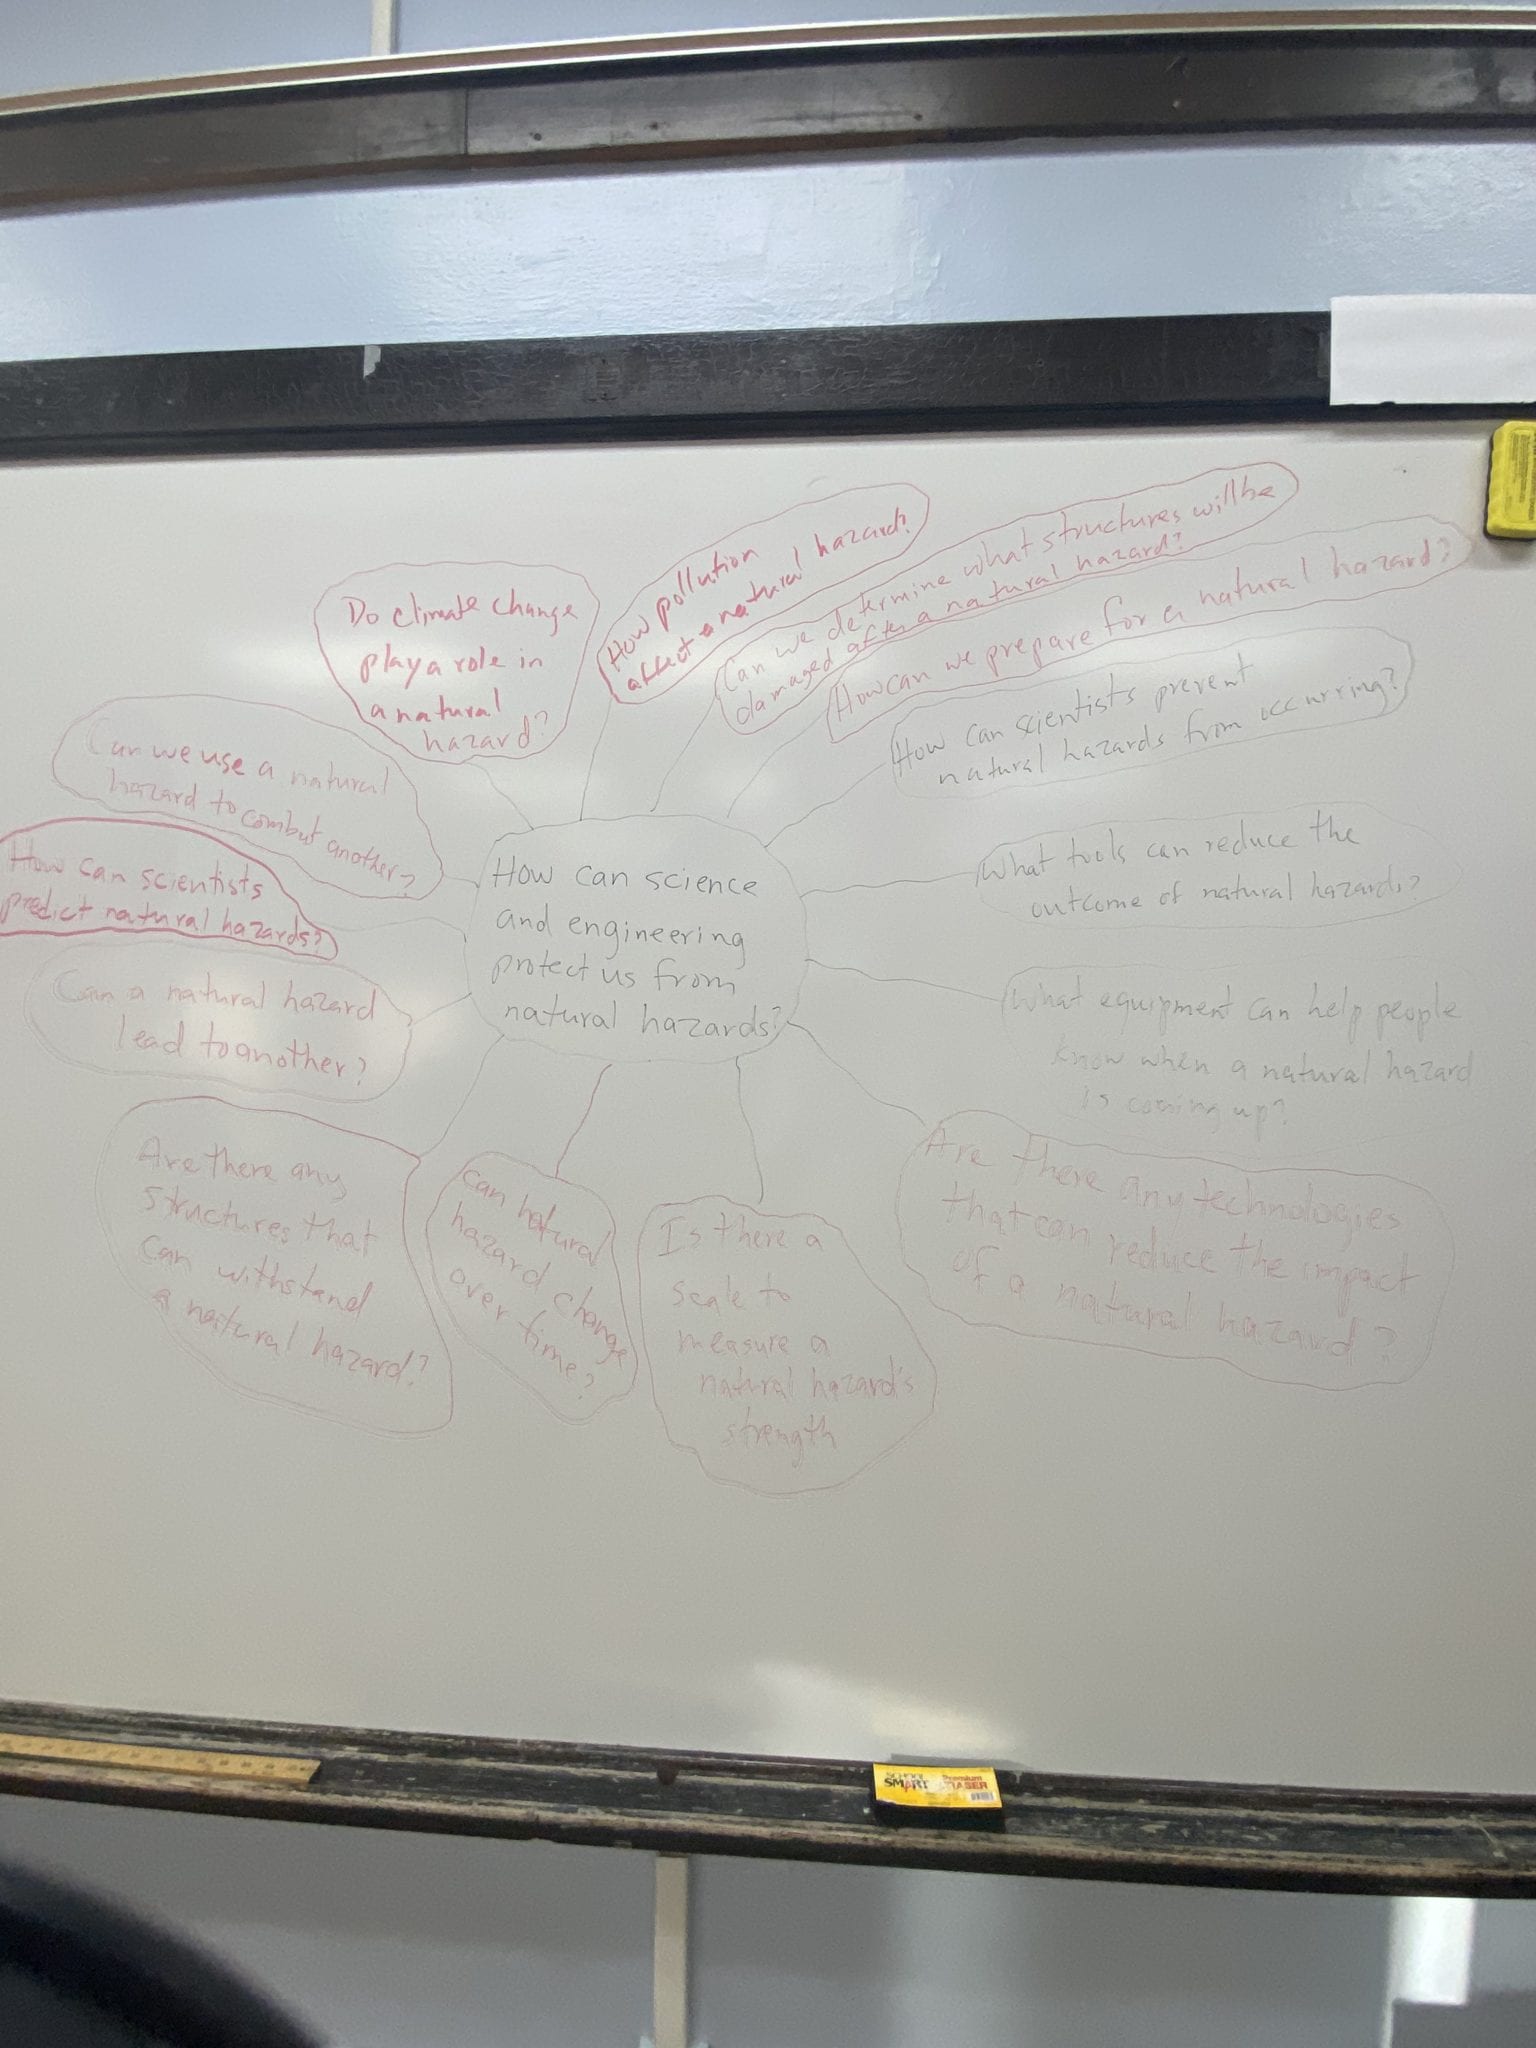
Posted in Class News
Leave a comment
Homework: Due Tomorrow, December 19, 2019
- Individually, compile a list of smaller questions you must answer in order to get at the Unit Challenge Question:
How can science and engineering help protect people from natural hazards?
Posted in Class News
Leave a comment