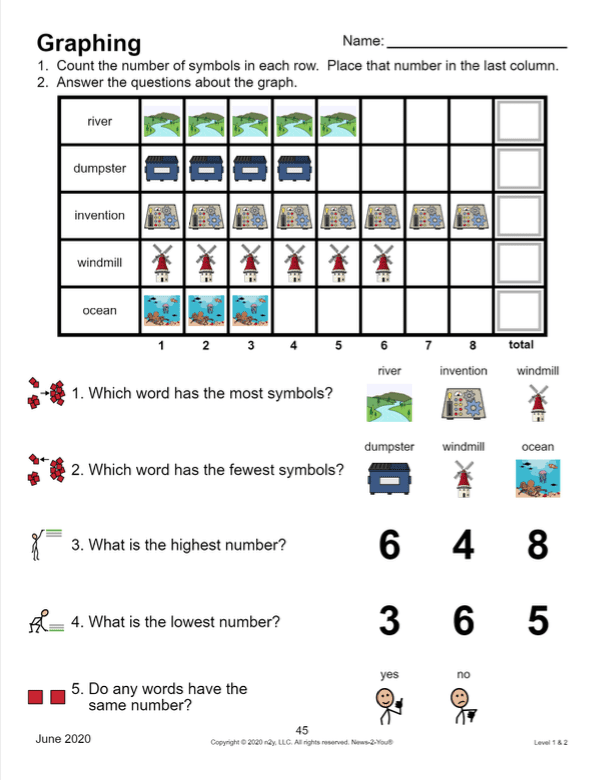
Right before school school ended, we introduced a lesson on how to make and read graphs. I started by starting with the simple bar graph. The height of each bar gives information, helping the children notice which columns have more objects and which columns have fewer objects. Bar graphs also help children sort and organize information.
Below I have a video story, few video lessons, and an activity for you to watch and work on.